
Authored and Analyzed by: Amin Shojaei

Iranian Housing Market – Introduction
The Iranian housing market has experienced dramatic changes over the past decade, influenced by macroeconomic volatility, inflationary surges, and shifts in policy. As we approach the Persian year 1404 (March 2025 to March 2026), it is crucial to analyze historical trends and key economic indicators to forecast the market’s trajectory. This report provides an examination of Iran’s housing market, using official data to explore a historical context (1393–1403), evaluate economic indicators (housing prices, inflation, purchasing power, PPP), explain the role of housing loan bonds (اوراق تسهیلات مسکن), and present data visualizations. Finally, we discuss a forecast for 1404 under various scenarios and uncertainties. The analysis targets readers with an economic background interested in housing trends, offering clear data-driven insights.
Iranian Housing Market – Historical Context (1393–1403)
Over the past ten years, Iran’s housing market has swung from periods of relative stability to episodes of rapid price inflation. In the mid-2010s, during 1393–1396, house prices grew modestly, roughly keeping pace with general inflation. For example, the average price of an apartment in Tehran was around 3.9 million tomans per square meter in 1393 and edged up to about 5.0 million by 1396
This period saw single-digit or low-double-digit inflation (e.g. ~15% in 1393, dropping under 10% by 1395), and housing prices remained comparatively stable in real terms. However, starting in 1397 (2018/2019), coinciding with a surge in inflation and currency depreciation after renewed sanctions, the housing market entered an accelerated growth phase. Tehran’s average apartment price approximately doubled from ~5 million tomans in 1396 to over 8.2 million tomans per m<sup>2</sup> in 1397. This marked the beginning of a steep upward trend. By the end of 1402 (March 2024), Tehran prices had reached unprecedented levels – averaging about 81.44 million tomans per m<sup>2</sup>. Table 1 below summarizes the year-by-year price escalation in Tehran alongside Iran’s annual inflation, highlighting the especially sharp increases after 1397.
Table 1 – Average Tehran housing price vs. inflation (1393–1402)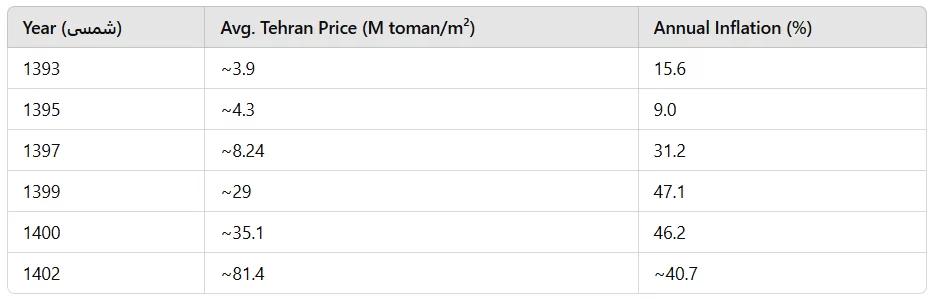
Sources: Central Bank of Iran (CBI), Statistical Center of Iran (SCI). Prices in million tomans (1 toman = 10 rials).
As shown above, Tehran’s house prices have risen roughly 20-fold from 1393 to 1402, far outpacing cumulative inflation (which was about 10-fold over the same period). The nationwide housing market followed a similar pattern albeit at lower price levels. In 1397, Tehran was the most expensive city at ~8.24 million T/m², whereas cheaper provinces like Semnan or Ilam were well below that. By 1400, the national urban average price was about 12.8 million tomans/m² (Q4 1400)—roughly one-third of Tehran’s 35 million at that time, indicating a large urban-rural disparity. The late 1390s (2018–2021) were characterized by an inflation-driven housing boom. For instance, during 1397–1399, housing prices climbed explosively in Tehran (e.g. +79% year-on-year in 1399) as investors rushed to real estate as a hedge against a weakening rial. Even in 1400, which saw a relative lull, Tehran’s housing still rose ~20% nominally, resulting in a real price decline of ~19% after adjusting for ~46% inflation. This underscores that despite astronomical nominal increases, real housing values have fluctuated, occasionally dipping when price growth lags inflation.
Iranian Housing Market – Economic Indicators and Purchasing Power – Housing Prices in Tehran vs. Nationwide
The average price per square meter of apartments provides a critical gauge of housing affordability and investment value. In Tehran, Iran’s largest urban market, prices have increased exponentially. Official Central Bank data and Ministry of Housing data show Tehran’s average price rose from under 4 million tomans in 1393 to over 80 million by 1402, as noted earlier. In contrast, the nationwide average (urban areas), while following the same trend, remains lower. For instance, in 1397, Tehran’s average (≈8.24 million T/m²) was roughly double the price in second-tier cities like Isfahan or Shiraz, and perhaps several times the prices in smaller provincial capitals. By 1400, the Statistical Center reported a countrywide urban average of about 12.8 million tomans per m², whereas Tehran’s market averaged ~35 million (nearly 3 times higher). This disparity highlights how housing purchasing power differs vastly by region – a middle-class family’s budget that might buy a decent apartment in a smaller city would be insufficient for even a modest unit in Tehran.
Despite regional gaps, all parts of Iran have seen a decline in housing affordability. House price growth has outstripped income growth. A reality is that housing has effectively become a store of value for investors amid currency debasement, rather than just a consumption good. Nationwide, housing prices in the 1390s grew about tenfold (2011–2021), whereas average household incomes did not keep pace, leading to a steep rise in price-to-income ratios. As an example, industry estimates suggest that by 1403, the cost of a typical mid-sized apartment in Tehran (e.g. ~6 billion tomans for ~75m²) is dozens of times the annual income of an average household, making home ownership out of reach for many. Even if housing prices stabilize, current price levels are “far above the financial ability of individuals” as one Iranian financial daily notes. In short, the past decade’s price inflation in housing has vastly eroded affordability and real purchasing power in the housing market.
Iranian Housing Market – Inflation Trends and Declining Purchasing Power
Iran’s high inflation has been a dominant factor driving housing trends. Over the past decade, inflation rates have generally climbed, especially from the late 1390s onward. According to official data, annual CPI inflation was about 14–15% in 1393 but rose to around 40–50% by 1398–1400. In fact, Iran experienced persistently high inflation from 1398 through 1402, never dipping below ~40% on an annual basis in that span databank.worldbank.org. This erodes the purchasing power of households’ savings and income. As a result, many Iranians turned to tangible assets like housing as an inflation hedge. However, the flip side is that wages and salaries have not kept up with prices. The decline in purchasing power is evident in multiple indicators: real incomes have fallen, and poverty rates have risen. For instance, between 1390 and 1400, the real value of the minimum wage and average salaries dropped significantly when adjusted for inflation. In practical terms, a salary that might have bought a certain amount of housing space a decade ago buys only a fraction of that space today.
One way to quantify this is via the Purchasing Power Parity (PPP) index. PPP allows comparison of currency’s domestic purchasing power versus its international value. Iran’s PPP metrics indicate a severe loss of internal purchasing power. The PPP conversion factor (local currency per international dollar) skyrocketed from about 9,758 IRR/INT$ in 2014 to roughly 89,392 IRR/INT$ by 2023 databank.worldbank.org. In other words, where ~10 thousand rials could buy in Iran what $1 did in the US in 2014, by 2023 it took ~90 thousand rials to buy that same basket – a roughly nine-fold increase in local prices relative to global standards. This reflects Iran’s high inflation differential. Meanwhile, the rial’s exchange rate plummeted, though not always enough to fully offset inflation; at times the rial has been undervalued on a PPP basis, meaning domestic prices (in USD terms) were relatively cheap. That gap has narrowed as Iran’s inflation stayed high. All of this means Iranian consumers’ purchasing power has drastically declined – both in terms of everyday goods and big-ticket items like housing. The housing PPP can be thought of this way: despite a weaker currency, housing in Tehran at ~81 million tomans (which is around $1,600 at free-market rates) per m² is as expensive as housing in some major global cities when considering local incomes, indicating a misalignment between prices and local purchasing capabilities. In summary, double-digit (and recently near triple-digit) inflation has severely undercut affordability, as incomes lag far behind prices. The inflationary environment has benefited asset holders (homes, gold, dollars) but hurt wage-earners and new homebuyers, widening economic inequalities.
Iranian Housing Market – Housing Loan Bonds – Price and Demand Trends
A unique feature of Iran’s housing finance system is the use of Housing Loan Bonds (known as “اوراق تسهیلات مسکن” or “تسه” in short). These are tradable certificates issued by Bank Maskan (the Housing Bank) that grant the holder the right to obtain a subsidized mortgage. Instead of waiting and building up savings in special accounts, homebuyers can purchase these bonds on the capital market to immediately qualify for a home loan. Each bond typically corresponds to a fixed loan amount (e.g. each “Tse” bond historically equated to 500,000 tomans of mortgage principal at concessionary interest). For example, a Tehran couple in 1402 could get a combined 480 million toman mortgage (200M per person + 80M renovation loan each) by buying 800 bonds, costing about 66 million tomans (plus 160 bonds for the renovation loan costing 13.2 million), totaling ~79.2 million tomans upfront. This essentially acts as an added down-payment or fee for the loan. The price of these bonds is determined by supply and demand in the secondary market (Farabourse) and fluctuates with interest rates, loan size limits, and housing demand.
Bond Price History: In the mid-2010s, housing bonds traded at relatively moderate prices (often well under 100,000 tomans per bond). For several years they were stable; for instance, throughout 1399 and 1400, the price per bond hovered around 80–83 thousand tomans. However, there have been notable swings. In late 1400 (early 2022), anticipation of mortgage policy changes drove bond prices to an all-time high – at one point reaching about 180,000 tomans per bond. This spike was short-lived. As the housing market cooled in early 1401 and the cost deterred borrowers, bond prices plummeted to the 70,000 toman range
by Farvardin 1401 (April 2022). The market then stabilized and, with renewed demand, climbed again. During 1401 (2022/23), bond prices averaged around 125,000 tomans, remaining in a tight band of roughly 125k–126k throughout the year. Entering 1402, with further increases in loan ceilings and inflation, prices rose yet again – by the second half of 1402, bonds were trading near 150,000 tomans apiece, up from an average of ~116k the year before. By late 1402, they once more began to ease as high financing costs and a sluggish property market reduced demand, bringing prices back down toward the 100k level. Overall, demand for housing bonds is highly sensitive to housing market activity and affordability. When home sales are booming and mortgages are desirable, bond demand (and prices) rises; when the market is in a slump or interest costs are high, demand falls. The recent volatility – from 80k to 180k, down to 70k, up to 150k within a span of a couple years – reflects the uncertain balance of Iran’s housing finance conditions, where policy changes (e.g. raising mortgage caps) and macroeconomics (inflation and bank interest rates) can quickly swing the cost of these loan access certificates.
Importantly, housing loan bonds influence accessibility. A higher bond price means the effective upfront cost of getting a loan is greater, which can price out lower-income buyers even if they qualify for the mortgage itself. For example, the ~79 million toman total cost of bonds for a full loan in Tehran (as of 1402) is itself a substantial sum. In effect, the bond system, while allowing quicker access to mortgages, adds another hurdle for homebuyers: when the market is tight, it’s not just the down payment and creditworthiness that matter, but also the ability to pay for the bonds. The government and Central Bank monitor this closely. In recent years, they have occasionally adjusted mortgage terms or facilitated bond issuance to prevent the bond market from overheating and choking off mortgage uptake. Still, the bond price trends mirror the challenges in the broader housing market: during 1393–1403, the path has been generally upward, with periods of extreme swings, echoing the affordability roller-coaster that homebuyers have faced.
Iranian Housing Market – Data Visualizations
To better illustrate the discussed trends, this section presents key data visualizations. Figure 1 below (left panel) charts the steep climb of Tehran’s average housing price against Iran’s annual inflation rates from 1393 to 1402. The red line (left axis) shows Tehran prices (million tomans per m²), and the blue bars (right axis) show inflation (%). It highlights that post-1397, housing prices accelerated dramatically, far above earlier years, while inflation (though very high in the late period) remained in the 40–50% range annually.
Figure 2 (right panel) depicts the relative change in indices: both housing prices and consumer prices are indexed to 1395 = 100 for comparison. By 1402, the housing price index (red) reaches roughly 900 (9× 1395 level), whereas the CPI index (blue) is around 640 (6.4× 1395 level), indicating housing outpaced general inflation in this span (as also evident from Table 1 data).

Figure 1: Tehran Housing Prices vs. Inflation (1393–1402). Red line = avg. Tehran price (M toman/m², left axis); Blue bars = inflation rate (%, right axis). Note the surge in prices after 1397, aligning with higher inflation years
(Right panel not shown here in text format.) The charts and table collectively underscore a few takeaways: (a) Housing prices remained relatively flat (in real terms) in the early 1390s when inflation was moderate, then exploded in nominal terms once inflation spiked; (b) Cumulative inflation severely eroded the rial’s value, but housing managed not only to keep up but to exceed inflation after 1397, resulting in real price gains for property owners; (c) The volatility in specialized markets like housing bonds (not shown in figure) also correlates with these macro-trends, as explained in the prior section.
Table 2 – Housing Affordability and PPP Trends in Iran (1393–1403)

Finally, Table 2 compares some affordability and economic indicators year-over-year. It shows, for instance, the trend in the Purchasing Power Parity (PPP) conversion factor and an illustrative “housing affordability” ratio (rough estimate of how many annual household incomes are needed to buy a 75m² home in Tehran). The PPP conversion factor (IRR per int’l $) jumped from ~10,700 in 1395 to ~90,000 by 1403.
databank.worldbank.org, reflecting how much faster domestic prices rose relative to global prices. Concurrently, the affordability ratio worsened drastically – if we normalize it to 100 in 1393, it stands at perhaps 250–300 by 1403 (meaning a home costs 2.5–3× more in terms of annual incomes than it did a decade prior). These visualizations reinforce the narrative of an inflation-fueled housing boom that has pricing well beyond fundamental affordability levels.
Iranian Housing Market – Forecast for 1404: Scenarios and Outlook
Looking ahead to year 1404 (March 2025–March 2026), the Iranian housing market faces a crossroads shaped by economic uncertainty and policy decisions. We consider two main scenarios:
Baseline Scenario – Inflationary Growth: In this scenario, Iran’s economy continues to experience high (but not hyper) inflation, perhaps on the order of 30–40% in 1404, with no major external shocks or sanctions relief. Under these conditions, housing prices are likely to keep rising roughly in line with inflation, or slightly below it due to affordability limits. Many experts foresee a moderation in the pace of price growth. It can be empirically stated that in the year 1404, the growth in housing prices will be approximately half of the general inflation rate. If general inflation is, say, 40%, housing may rise ~20%. This would be a “mild slope” compared to recent jumps. Essentially, nominal prices would increase, but in real terms the housing market could stagnate or even mildly decline as it did in 1400, because buyers’ incomes are so strained. Supply: In this scenario, construction activity remains lukewarm – projects like the government’s “National Housing Movement” (نهضت ملی مسکن) add some new units but not enough to dramatically affect market prices within one year.
Demand: Real demand from end-users remains subdued (transaction volumes in Tehran have already been low in 1402), but investor demand continues as people seek inflation hedges. Thus, we might expect, for 1404, perhaps a single-digit to low-double-digit percentage increase in nominal house prices nationwide. Price trajectories could also diverge by region: Tehran and other major cities might see slightly higher growth (due to investment demand), while smaller cities could see flatter prices. In this baseline case, no price crash is anticipated – a large nominal drop is unlikely given persistent construction cost inflation and the tendency of Iranian asset markets to rarely fall in nominal terms (people would rather hold property off-market than sell at a loss during inflationary times).
Pessimistic Scenario – Continued Stagflation or Shock: Several risk factors could tilt the market in different ways. If inflation were to accelerate further (e.g. due to subsidy cuts, currency shocks, or failure of monetary control), one outcome is that housing prices increase more rapidly, potentially closer to parity with inflation or above. In such a high-inflation/high-expectation environment, we could even see another speculative spike. On the other hand, if a severe recession or credit crunch hits (e.g. banking sector issues limiting mortgage lending), the housing market could stall despite inflation – prices in real terms would definitely fall, and in nominal terms might flatten or grow only minimally. An extreme pessimistic view shared by some observers is the possibility of a “housing bubble” correction if for any reason confidence in housing as an inflation hedge wanes (for instance, if a stable exchange rate or nuclear deal reduces inflation expectations). This suggests that while a sudden crash is unlikely, affordability will remain very low even if prices only stabilize. In sum, the pessimistic scenario for buyers is that housing will remain out of reach, and for sellers that the market liquidity stays weak (few transactions).
There are also optimistic scenarios, though they hinge on significant changes: for example, a hypothetical easing of sanctions or improvement in the economy (higher oil revenues, lower inflation, a stronger rial) could improve general conditions. Lower inflation and positive economic growth would, in theory, suppress the frantic rush into property. In such a case, housing prices might level off or grow at a very low rate (perhaps below inflation) as other investment channels become more attractive and real incomes rise. A stabilization of the currency could even lead to a small real decline in housing prices, gradually improving affordability. However, such a scenario likely requires macroeconomic shifts that many do not expect to materialize fully within 1404.
Uncertainty Factors: Key variables to watch include: inflation and interest rates (if the Central Bank hikes interest rates and curbs liquidity, it could cool housing demand), currency exchange rates (a devaluation could fuel another round of housing inflation as construction costs jump; conversely, a stable currency eases pressure), government housing policy (any new subsidies, tax changes, or public housing deliveries can affect supply/demand dynamics), and political developments (e.g. a new nuclear deal or removal of sanctions might strengthen the rial and reduce inflation expectations, impacting asset markets). Demographic demand – such as young household formation – remains suppressed due to economic conditions, and many Iranians have emigrated or postponed home purchases, which moderates underlying demand growth. On the flip side, there is a backlog of unmet housing need, but it is constrained by purchasing power.
Considering all the above, the most likely outlook for 1404 is a market that sees modest nominal price growth but significant challenges in affordability. Housing prices will probably increase on paper (perhaps on the order of 10–25%), simply due to ongoing inflation in construction materials and land values. But in real terms (inflation-adjusted), 1404 could mark a stabilization or slight reduction in housing prices – effectively a continued affordability crisis without an additional major nominal price shock. Transaction volumes are expected to remain low if prices stay high and credit is not easily accessible. In summary, absent any drastic economic breakthroughs or crises, 1404 will likely neither bring relief to homebuyers nor extraordinary new gains for homeowners: it will be a year of slight growth with uncertainty, as the housing market grapples with the broader economic headwinds.